サーバーサイドエンジニアの田実です!
ヤプリではデータ分析・監視のツールとしてRedashを活用しています。
Redashは様々なデータソースを一元的に表示・監視ができる開発・運用には欠かせないツールなのですが、デフォルトのデータソースが一部のAWSのリソースに対応しておりません。
例えば、現時点でのstable release(v8.0.0)のデータソースでは、S3のバケット内のオブジェクトを一覧表示したり、CloudWatch Logs Insightsを使ってログを取得することができません。
本記事では任意のAWSのリソースをRedashのPythonデータソースを使って表示する方法をご紹介します!
CloudWatch Logs Insightsの例
Redashをホスティングしているサーバーにboto3をインストールし、対象のAWSリソースにアクセスできるようにIAMを調整します。 その後、Pythonデータソースでboto3を使ってスクリプトを書いていきます。
以下のスクリプトはCloudWatch Logs Insightsのデータを取得する例です。
import boto3
from datetime import datetime, timedelta
import time

logGroupName = '{{ ロググループ名 }}'
queryString = 'fields @timestamp, @message | filter /{{ 検索文字列 }}/'

startTime = datetime.strptime('{{ 期間.start }}', '%Y-%m-%d %H:%M:%S') - timedelta(hours = 9)
endTime = datetime.strptime('{{ 期間.end }}', '%Y-%m-%d %H:%M:%S') - timedelta(hours = 9)

# クエリ開始
client = boto3.client('logs', region_name='ap-northeast-1')
start_query_res = client.start_query(
    logGroupName=logGroupName,
    startTime=int(time.mktime(startTime.timetuple())),
    endTime=int(time.mktime(endTime.timetuple())),
    queryString=queryString
)
queryId = start_query_res['queryId']

# ポーリングしてクエリ結果を取得
res = client.get_query_results(
    queryId=queryId
)
status = res['status']
while status == 'Running' or status == 'Scheduled':
    time.sleep(1)
    res = client.get_query_results(
       queryId=queryId
    )
    status = res['status']

# クエリ結果をRedashに反映
result = {}
for r in res['results']:
    add_result_row(result, {'timestamp': r[0]['value'], 'message': r[1]['value']})

add_result_column(result, 'timestamp', '', 'string')
add_result_column(result, 'message', '', 'string')

result["metadata"] = {"data_scanned": res['statistics']['bytesScanned']}
CloudWatch Logs InsightsのStartQueryは非同期で処理されるのでポーリングする必要があります。
上の例では time.sleep して待ちつつGetQueryResultsで結果を取得しています。
res = client.get_query_results(
    queryId=queryId
)
status = res['status']
while status == 'Running' or status == 'Scheduled':
    time.sleep(1)
    res = client.get_query_results(
       queryId=queryId
    )
    status = res['status']
取得したデータは add_result_row add_result_column を使って表示します。
また、metadataを設定することでスキャンしたデータ量をフッタに表示することができます。
result["metadata"] = {"data_scanned": res['statistics']['bytesScanned']}
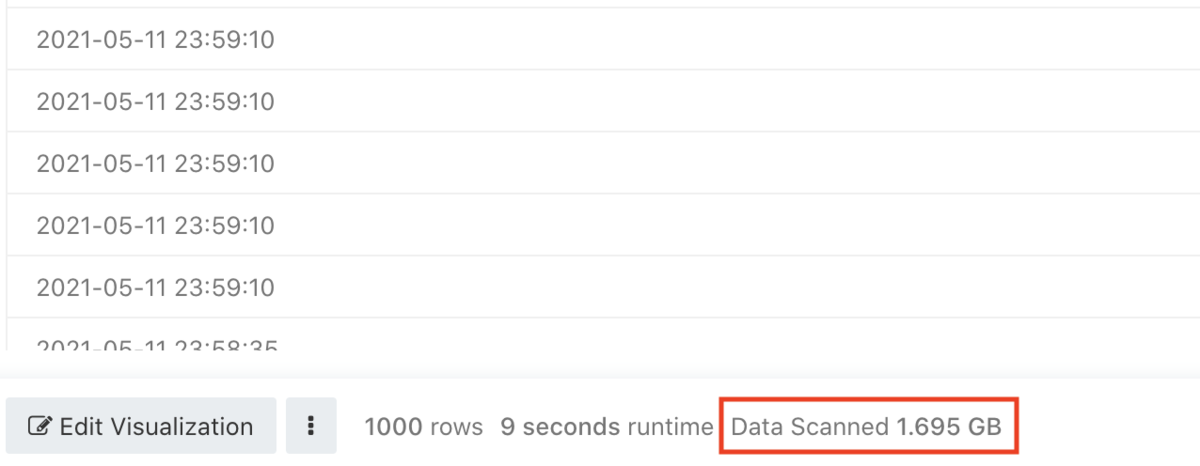 BigQueryのデータソースを使うとフッタにスキャンしたデータ量が表示されるのですが、これと同じ仕組みを使っています。
CloudWatch Logs Insightsもスキャンしたデータ量に応じた課金体系になっておりますので、スキャン対象が大きくなりすぎないように注意喚起の意味で表示することができるようになります。
BigQueryのデータソースを使うとフッタにスキャンしたデータ量が表示されるのですが、これと同じ仕組みを使っています。
CloudWatch Logs Insightsもスキャンしたデータ量に応じた課金体系になっておりますので、スキャン対象が大きくなりすぎないように注意喚起の意味で表示することができるようになります。
ちなみにRedash v9 betaのCloudWatch Logs Insightsデータソースの処理も同じような内容になっています。 github.com
S3の例
S3バケット内のオブジェクト一覧を表示する場合は以下のように記述します。
import boto3

def add_results(result, res):
    for r in res['Contents']:
        add_result_row(result, {
            'key': r['Key'],
            'lastModified': r['LastModified'],
        })

bucket = 'sample'
client = boto3.client('s3', region_name='ap-northeast-1')
res = client.list_objects_v2(
    Bucket=bucket,
)
result = {}
add_results(result, res)
while res['IsTruncated']:
        continuation_key = res['NextContinuationToken']
        res = client.list_objects_v2(
            Bucket=bucket,
            ContinuationToken=continuation_key,
        )
        add_results(result, res)

add_result_column(result, 'key', '', 'string')
add_result_column(result, 'lastModified', '', 'string')
S3のListObjectsV2は同期的にレスポンスを返すのでCloudWatch Logs Insightsの例よりはシンプルになっています。 サンプルでは全件取得するためにIsTruncatedがfalseになるまで繰り返しリクエストをしています。
まとめ
RedashのPythonデータソースを使ってAWSのリソースを参照する方法を紹介しました! 独自のクエリランナーを作らずに、PythonデータソースだけでAWSのリソースを参照することが可能なので、アドホックに調査するケースでは便利だと思います。*1
*1:とはいえ同じようなクエリが増えてきたら、独自クエリランナーを作ったほうが保守性が良さそう